Climate Change Mitigation in Developing Countries
- Climate, Coursework, Developing World, Featured, Sustainable Development
- climate change, climate mitigation, Featured, SDG 12, sustainable consumption, sustainable development, sustainable development goals
- June 19, 2016
The following reflects course work for the MOOC Climate Change Mitigation in Developing Countries offered by Professor Harald Winkler of the University of Capetown, South Africa
Week 1:
Sustainable consumption patterns – a Super Wicked problem
Week 2:
Awareness and Response : Actions to Reduce Emissions from Personal Energy Use
Week 3:
A Slightly Anomalous American
Week 4:
A Gap as Wide as the Grand Canyon
Week 5:
Innovation, awareness, and education: making change in America
Week 6:
California cap and trade policy: A framework for change
Sustainable Consumption Patterns – a Super Wicked Problem
Week 1
The other side of the development coin is sustainable consumption. Meeting the basic needs of a growing global population, expected to reach 9.5 billion people by 2050, while ensuring a sustainable development path for emerging economies, requires a concerted and collaborative effort from the developed world to adopt more sustainable patterns of consumption.
Consumption is the foundation of a modern capitalist economy, the largest component of GDP, currently the basic measure of economic health. Many, but certainly not all, have benefited from this meteoric rise in economic growth and consumption. But it is unsustainable. We are embedded in an economic system that cannot be sustained, particularly given the concurrent growth in human population. It is a super-wicked problem.
I consider this super-wicked problem from the perspective of a baby-boomer born in the late 1950s, a decade many characterize as the beginning of the “Great Acceleration,” when consumption of resources, goods and services skyrocketed, particularly in the United States.
The energy source driving this expansion of consumption is fossil fuel. In 1958, the year I was born, the CO2 observatory atop Mauna Loa on the island of Hawaii began taking measurements of atmospheric concentration of CO2. The first measurement of the “Keeling Curve,” named after Dr. Charles Keeling, was approximately 285 parts-per-million (ppm) of CO2. As of this writing the measurement from Mauna Loa is nearly 407 ppm.
The period of my lifetime clearly shows a correlation between consumption, energy use and CO2 in the atmosphere, and with that warming average global temperatures.
While developing countries must adopt a sustainable development path, the developed world must seek out more sustainable patterns of consumption.
There are a number of possible pathways to sustainable consumption, among them:
- Circular economy – “restorative and regenerative by design”
- Efficiency and decoupling – reducing the rate of resource consumption per unit of economic activity
- More holistic measurement of economic health – adjusting economic indicators to account for social and environmental costs of consumption
Sustainable consumption is also addressed in Goal 12 of the Sustainable Development Goals, adopted by the United Nations in 2015.
Awareness and Response : Actions to Reduce Emissions from Personal Energy Use
Week 2
The system
The system I consider for this assignment is residential energy use for a family of two living in an apartment of approximately 1200 square feet in San Francisco, CA. The specific context is consumption of electricity and natural gas within this apartment.
The goal of the proposed intervention in this system is three-fold:
- reduce consumption of energy
- increase energy efficiency
- utilize the regional options available for choosing the source of energy, particularly electrical generation from renewable energy sources.
Actions within the system
The actions of the system encompass the daily patterns of life in an urban center in the United States.
The actions within this system of family energy use include electricity for powering electronics and other appliances, lighting, and heating (space heaters). Natural gas is a primary source of energy generation in California. The state is a net importer of energy.
The resulting greenhouse gas emissions resulting from the system are primarily from the extraction, combustion, and distribution of natural gas. However, consumers in San Francisco have options for choosing the source, or the mix of sources, of electricity generation.
Considerations
Much of California is a Mediterranean climate, which impacts energy use for heating and cooling. The region has several micro-climates and the coastal climate of San Francisco is characterized as having “natural air conditioning.”

Interventions
- Information:
The first intervening action is the collection of data. What isn’t measured can’t be managed. Pacific Gas and Electric uses smart metering, which allows consumer access to energy data use over several metrics, including time-of-day and comparative analysis. A benchmark is established with this data. Goals are established against the benchmark for reducing overall energy consumption
-
Behavioral considerations:
- Time-of-day energy use data is a useful tool for identifying daily patterns of behavior the lead to increased energy consumption. Once identified, these actions can be modified.
- Despite the best of intentions, common actions within the system can be difficult to modify. Sometimes even impractical within the context of the system. For instance, reducing vampire loads from appliances and electronics that consume power even when “switched off” is cumbersome. Using technology such as apps to monitor and control specific electrical outlets can Incentivize the habit of turning off sources of “stand-by” power consumption when not needed.
-
Lighting
The cost of LED has dropped significantly. Currently about 40 percent of the lighting in our apartment uses LED lighting. As older bulbs, either CFL or incandescent, reach the end of their useful life they will be replaced with LED bulbs.
-
Opt-in
San Francisco residents have available a program called CleanPowerSF. Participating in the program is voluntary, with two tires available, Green provides 35 percent of electricity consumption from renewable sources; SuperGreen promises 100 percent of consumed electricity from clean energy sources, at a slight premium over basic utility rates.
-
Reducing emissions
The cumulative impact of the interventions described here will reduce emissions and creates a systematic process of energy consumption awareness and monitoring.
Using the SuperGreen program will significantly reduce emissions from electricity consumption. However, it is important to note the issue of the “efficiency paradox,” also known as the Jevons Paradox, which asserts that increased efficiency leads to increased consumption.
A Slightly Anomalous American
Modeling energy consumption and carbon footprint from energy and transportation
The research this week relates to my previous post looking at my personal residential energy use for two people living in an apartment in San Francisco.
To reflect energy use assumptions relevant to the United States I used the EPA carbon footprint calculator to model my Carbon Footprint Calculator _ Climate Change _ US EPA.
I used the EPA’s online calculator and also downloaded the spreadsheet version of the model for use later.
Energy consumption and carbon footprint summary
Monthly average for past 12 months
- Natural gas: 23 therms – represents 3,370 lbs. annual CO2e, higher than similar homes within PG&E’s dataset
- Electricity: 203 kWh – represents 1,494 lbs. CO2e, better than average but higher than most efficient similar homes within PG&E’s dataset. As of May 2016 100 percent of electricity is generated from renewable sources under the CleanPowerSF program.
Conclusions
Natural gas
Based on this simple model scenario my carbon footprint is largest due to consumption of natural gas. This may be due to water heating. Inspection of piping and fittings in this nearly century-old building may reveal opportunities to reduce gas consumption.
Electricity
Electricity generation from 100 percent renewables is based on the accuracy of the information provided by CleanPowerSF. Further individual verification of the generation source is a possible next step.
Travel
- I do not own a car, somewhat rare in the U.S.
- I travel primarily by walking and public transit.
- I belong to a car sharing non-profit, using a car a few times a year.
- I regularly use taxi service (not Uber, etc.)
- In 2015 I took three domestic flights averaging about 1000 miles each. I took one international trip, four separate flights total roundtrip, from San Francisco to Paris.
These are not included in the model presented here, but will be soon. I estimate the plane travel, and all its ancillary sources of emissions, as the largest source of emissions.
A Gap as Wide as the Grand Canyon
Where we are:
For the past two weeks my context under consideration has been a single urban residential user, a rented flat for a family of two people in San Francisco, CA.
This week we broaden the context to a national focus, the United States. With the very significant exception of air travel, our carbon footprint is lower than the average American.
The United States is second in aggregate emissions but remains the highest emiting nation per capita.
The U.S. INDC – or Intended Nationally Determined Contribution – pledges reduction of 26-28 percent reduction of emissions over 2005 levels by 2025, with a longterm goal of on 80 percent reduction by mid-century.
The Paris Agreement adopted at the COP21 climate conference last year calls for a “decarbonized” economy by the end of the century.
Development vs. consumption – an economic paradox
The global community is at a crossroads on what is sustainable between development and consumption. For developing countries, the challenge may be right to develop and provide better lives for their citizens, but in context of limits on resources, not imposed on the early growth of developed countries, and costs previously externalized, but now required in the full accounting. This imposes a different, maybe unknown, path to development.
Here in the developed world, and especially in the United States, the challenge is awareness, curbing excess, reducing consumption and increasing efficiency.
This is a tough sell, I think, mostly due to social and political reasons.
The post World War 2 boom focused the wartime production output on consumers, ushering in the Great Acceleration in the 1950s. I was born in 1958 and I remember when I was a kid gas cost about .29 cents/gallon. The gas stations gave away free glassware to complement the kitchen of the suburban home, made possible by access to cheap, mostly worry-free (at least for a time) energy.
The current US INDC is ambitious, but not ambitious enough. A “decarbonized” economy that includes the developed world is an economy built on a primary energy source other than fossil fuels. What is emitted is captured. Perhaps even technologies will develop and scale to create “negative emissions” by removing carbon from the atmosphere.
The technical challenges, while significant, I believe can be met. The real challenge is political and social will.
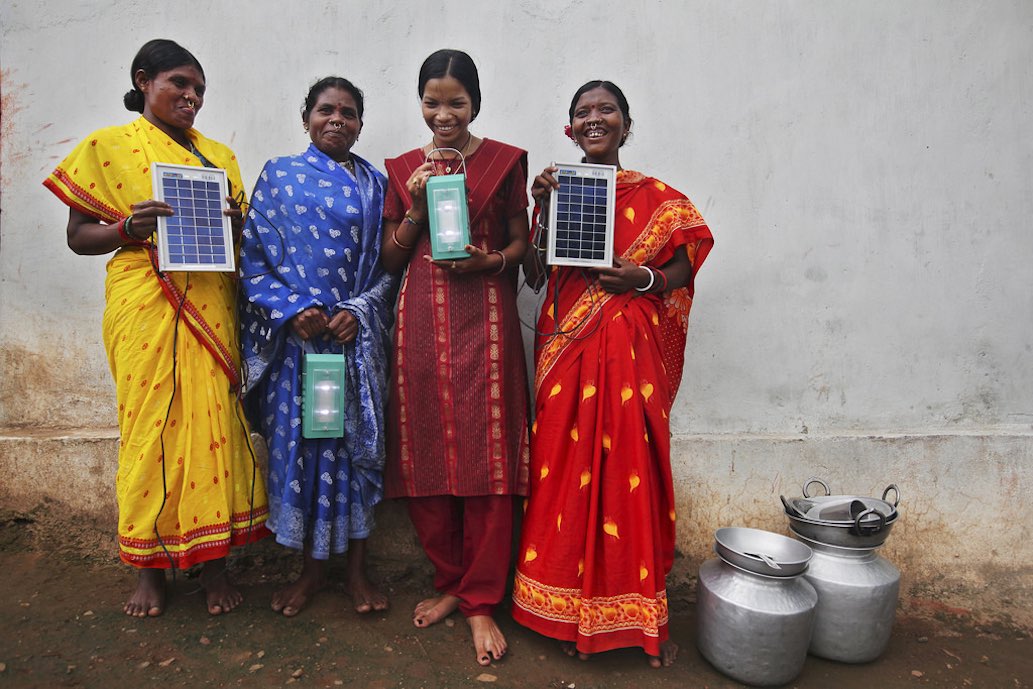
Featured image credit: UK Department for International Development, courtesy Flickr
Innovation, awareness, and education: making change in America
As the largest global economy and highest per-capita energy consumer, the United States a unique opportunity, in partnership with other developed countries, to lead the global community toward a low-carbon energy future. It can be argued that it is also the responsibility of the U.S. to lead.
Discussing the entire scope of possible climate mitigation innovation within the U.S. is beyond the scope of this assignment, but there are two innovative ideas and developments to look at that point to larger issues of change as discussed in week 5 of the course. One focuses on technology, the other on “softer” socio-economic issues.
Energy storage
In my work as a freelance environmental journalist, I covered the Intersolar North America 2016 solar industry trade show in San Francisco this past week.
Energy storage is both a challenge and opportunity for market penetration of renewable energy sources. What I discovered this week is how much of the industry is focused on energy storage development across all applications, from short-duration residential systems to long-duration utility-scale storage.
One particular design of interest is a hybrid iron flow battery developed by ESS (Energy Storage Systems). The main components of the shipping-container-sized battery are iron, salt, and water. This type of battery represents a technical innovation helping to pave the way for renewable energy development. The ESS system 100kW/800kWh battery has a 6-8 hour nominal discharge time.
On small island nations, this technology can drastically reduce, perhaps even eliminate, the need for expensive and dirty diesel generation.
In large developed countries, advances in iron flow battery technology address a principle challenge for renewable baseload generation – intermittency.
Education and awareness
The advantages of technical innovation are clear. Just as important is equal innovation for market analysis, information, and education for a new energy economy. This is true both in the developed and developing world, though obviously, the specific circumstances of each are vastly different.
The developed world must transform its energy infrastructure, and thus the global economy. Emerging economies must balance development with the urgency of climate mitigation.
In the U.S. organizations like The Solar Foundation focus on the “soft costs” of solar, training and worker development, and market transformation.
The latest national solar job census shows continued growth in the U.S. solar market that consistently exceeds expectations.
Along with rapid technical advances, programs aimed at the socio-economic aspects of solar are important innovations for a low carbon economy.
Developing a workforce and educating stakeholders about solar power integration reveals common ground for change
California cap and trade policy: A framework for change
In the U.S., California is a leader in developing and implementing emissions mitigation policy.
The California Global Warming Solutions Act of 2006 (Assembly Bill 32 or “AB32“) passed the state legislature in August of 2006 and was signed into law by then-governor Arnold Schwartzenneger.
The policy calls for a reduction in emissions to 1990 levels by 2020, reflected a 15 percent reduction in emissions by 2020 from a business-as-usual trajectory.
Using a cap-and-trade mechanism as a principal means of mitigation, AB32 sets a statewide limit on emissions sources responsible for 85 percent of California’s greenhouse gas emissions.
Scoping plan
AB32 mandates a “Scoping Plan” to map implementation of the policy’s mitigation objectives.
Developed by the California Air Resources Board (CARB), the initial scoping plan” was agreed to in December of 2008 , with regular updates since that time, the latest being approved in May of 2014.
Based on this update, Governor Jerry Brown issued Executive Order B-30-15 in April 205 establishing a mid-term emissions reduction target of 40 percent over 1990 levels by 2030. This is the most ambitious GHG reduction target in North America.

Implementation of emissions cap and trade
A brief timeline of implementation:
- January 2012:
Market mechanisms and greenhouse gas rules developed by CARB come into force and are legally binding - November 2012:
The first quarterly auction of emissions allowances is held. - January 2013:
Cap-and-trade program begins for energy generation and industrial facilities emitting 25,000 MTCO2e (metric ton CO2 equivalent) or more annually. Cap is initially set at 2 percent below projected 2012 emissions. - September 2013:
California Air Resources Board issues first carbon offset credits. - January 2014:
Carbon cap declines 2 percent from the initial set cap.
- In 2014 California links with Quebec, Canada cap-and-trade program.
- January 2015:
Carbon cap comes into force for distributors of transportation, natural gas, and other fuels.- In 2015 cap declines 3 percent. Set to decline 3 percent from 2015 to 2020.
- December 31, 2020:
Deadline for achieving 2020 GHG emissions cap.
Economic implications
Numerous studies on the economic implications of AB32 are available, including the latest economic analysis from the CARB Scoping Plan.
The Union of Concerned Scientists published an analysis in 2009, as did the University of California-Berkeley Center for Labor Research and Education.
A pathway for change in the developed world
California’s gross state product (GSP) nearly $2.5 trillion dollars in 2015, or 13.7 percent of the U.S. total GDP.
The California economy is the sixth largest in the world. As discussed in the final lecture, addressing climate change must be a global issue. No single state or nation can meet the scale of such a “wicked problem.”
The Global Warming Solutions Act demonstrates a policy that can be linked and modeled as part of the bridge from domestic policy to international contributions.


Peter Atkins
Interesting, entertaining, authoritative and easy to read!
Thank you!
(I’m one of the support staff on the Climate Change Mitigation MOOC).
Thomas Schueneman
Hi, Peter – thanks for reading my work and for the kind words. I thoroughly enjoyed this course. Very instructive and enlightening!
Daniel R.
A major problem I see is that, in order to grow as a modern society, a developing country needs to consume. It also takes money for those developing countries to purchase the technological innovations that help reduce their carbon footprint. Like the old adage- “it takes money to make money”.
Miranda Kennedy
Excellent series summarizing in concise explanations crucial considerations for our intertwined environmental and economic systems.
I came upon these articles in search of a map of Mediterranean climates (and stayed to read!): on that note, I was hoping to learn what the copyright/usage restrictions are for that map (in Awareness and Response : Actions to Reduce Emissions from Personal Energy Use — Week 2: Considerations).